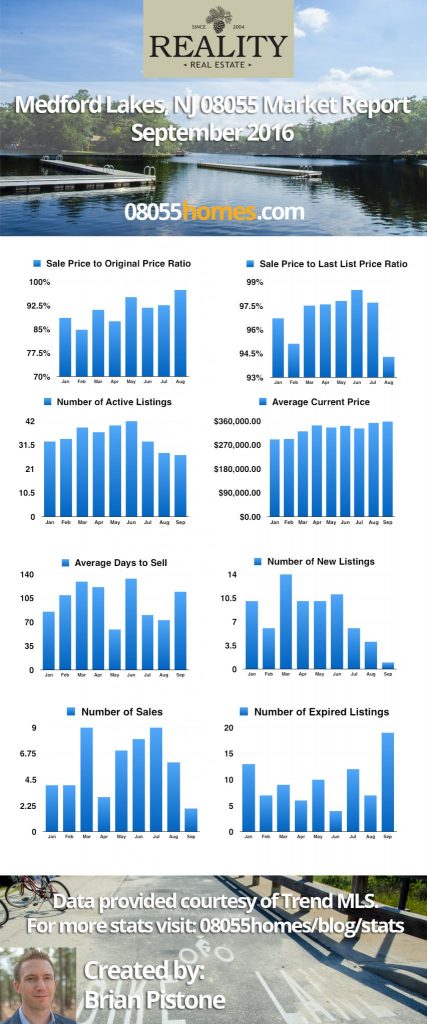
The Medford Lakes Real Estate Market Report will be published on a monthly basis. Data provided courtesy of Trend MLS from January to September, 2016 in the Medford Lakes Boro, Burlington County MLS Area. The tables below represent the data used for the charts above.
|
Month |
Sale Price to Original Price Ratio 2016 |
|
Jan |
88.6% |
|
Feb |
84.8% |
|
Mar |
91.2% |
|
Apr |
87.5% |
|
May |
95.1% |
|
Jun |
91.8% |
|
Jul |
92.6% |
|
Aug |
97.5% |
|
Month |
Sale Price to Last List Price Ratio 2016 |
|
Jan |
95.1% |
|
Feb |
96.7% |
|
Mar |
94.3% |
|
Apr |
97.7% |
|
May |
98.5% |
|
Jun |
97.8% |
|
Jul |
97.6% |
|
Aug |
97.5% |
|
Month |
Active Listings, Number of 2016 |
|
Jan |
33 |
|
Feb |
34 |
|
Mar |
39 |
|
Apr |
37 |
|
May |
40 |
|
Jun |
42 |
|
Jul |
33 |
|
Aug |
28 |
|
Sep |
27 |
|
Month |
Current Price, Average 2016 |
|
Jan |
$290,703.00 |
|
Feb |
$292,021.00 |
|
Mar |
$320,167.00 |
|
Apr |
$343,476.00 |
|
May |
$334,335.00 |
|
Jun |
$341,121.00 |
|
Jul |
$331,873.00 |
|
Aug |
$352,696.00 |
|
Sep |
$358,056.00 |
|
Month |
Days to Sell, Average 2016 |
|
Jan |
85 |
|
Feb |
109 |
|
Mar |
129 |
|
Apr |
121 |
|
May |
59 |
|
Jun |
133 |
|
Jul |
80 |
|
Aug |
73 |
|
Sep |
114 |
|
Month |
Number of New Listings |
|
Jan |
10 |
|
Feb |
6 |
|
Mar |
14 |
|
Apr |
10 |
|
May |
10 |
|
Jun |
11 |
|
Jul |
6 |
|
Aug |
4 |
|
Sep |
1 |
|
Month |
Sales, Number of 2016 |
|
Jan |
4 |
|
Feb |
4 |
|
Mar |
9 |
|
Apr |
3 |
|
May |
7 |
|
Jun |
8 |
|
Jul |
9 |
|
Aug |
6 |
|
Sep |
2 |
|
Month |
Expired Listings, Number of 2016 |
|
Jan |
13 |
|
Feb |
7 |
|
Mar |
9 |
|
Apr |
6 |
|
May |
10 |
|
Jun |
4 |
|
Jul |
12 |
|
Aug |
7 |
|
Sep |
19 |
What is a good day and time to talk?